Difference Between T-TEST and ANOVA

T-TEST vs. ANOVA
Gathering and calculating statistical data to acquire the mean is often a long and tedious process. The t-test and the one-way analysis of variance (ANOVA) are the two most common tests used for this purpose.
The t-test is a statistical hypothesis test where the test statistic follows a Student’s t distribution if the null hypothesis is supported. This test is applied when the test statistic follows a normal distribution and the value of a scaling term in the test statistic is known. If the scaling term is unknown, it is then replaced by an estimate based on the available data. The test statistic will follow a Student’s t-distribution.
William Sealy Gosset introduced the t-statistic in 1908. Gosset was a chemist for the Guinness brewery in Dublin, Ireland. The Guinness brewery had the policy of recruiting the best graduates from Oxford and Cambridge, selecting from those who could provide applications of biochemistry and statistics to the company’s established industrial processes. William Sealy Gosset was one such graduate. In the process, William Sealy Gosset devised the t-test, which was originally envisioned as a way to monitor the quality of the stout (the dark beer the brewery produces) in a cost-effective way. Gosset published the test under the pen name ‘Student’ in Biometrika, circa 1908. The reason for the pen name was Guinness’ insistence, as the company wanted to keep their policy about utilizing statistics as part of their ‘trade secrets’.
T-test statistics generally follow the form T = Z/s, where Z and s are functions of the data. The Z variable is designed to be sensitive to the alternative hypothesis; effectively, the magnitude of the Z variable is larger when the alternative hypothesis is true. In the meantime, ‘s’ is a scaling parameter, allowing the distribution of T to be determined. The assumptions underlying a t-test are that a) Z follows a standard normal distribution under the null hypothesis; b) ps2 follows an χ2 distribution with p degrees of freedom under the null hypothesis (where p is a positive constant); and c) the Z value and s value are independent. In a specific type of t-test, these conditions are consequences of the population being studied, as well as the way in which the data are sampled.
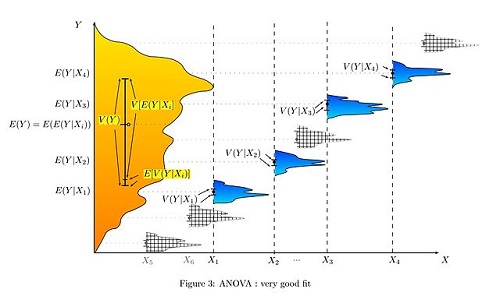
On the other hand, the analysis of variance (ANOVA) is a collection of statistical models. While principles of ANOVA have been utilized by researchers and statisticians for a long time, it wasn’t until 1918 that Sir Ronald Fisher made a proposal to formalize analysis of variance in an article titled ‘The Correlation Between Relatives on the Supposition of Mendelian Inheritance’. Since then, ANOVA has been expanded in its scope and application. ANOVA is actually a misnomer, as it is not derived from the differences of variances but rather from the differences between means of groups. It includes the associated procedures where the observed variance in a particular variable is partitioned into components attributable to different sources of variation.
Essentially, an ANOVA provides a statistical test of to determine if the means of several groups are all equal and, as a result, generalizes t-test to more than two groups. An ANOVA can be more useful than a two-sample t-test as it has a lesser chance of committing a type I error. For instance, having multiple two-sample t-tests would have a greater chance of committing an error than an ANOVA of the same variables involved to obtain the mean. The model is the same and the test statistic is the F ratio. In simpler terms, t-tests are just a special case of ANOVA: doing an ANOVA will have the same result of multiple t-tests. There are three classes of ANOVA models: a) Fixed-effects models which assume the data comes from normal populations, differing only in their means; b) Random effects models that assume the data describes a hierarchy of varying populations whose differences are constrained by the hierarchy; and, c) Mixed-effect models which are situations where both the fixed and random effects are present.
Summary:
- The t-test is used when determining whether two averages or means are the same or different. The ANOVA is preferred when comparing three or more averages or means.
- A t-test has more odds of committing an error the more means are used, which is why ANOVA is used when comparing two or more means.
- Differences Between Fraternity And Sorority - January 8, 2014
- Differences Between Lucite and Plastic - January 7, 2014
- Differences Between Oil and Butter - January 6, 2014
Search DifferenceBetween.net :
3 Comments
Leave a Response
References :
[0]https://commons.wikimedia.org/wiki/File:ANOVA_very_good_fit.jpg

To whom it may concern.
I am saying thank you because your site realy helped me a lot in dealing with interpreting my project analysis. A project on Quality control supervised by my able lecturer ( Mr. O. Job). University of Ilorin, Kwara State. Nigeria. Merci.
Very useful info………
Beautiful. I found it useful. Thanks.